Emphasis Areas
Table of Contents:
PEDESTRIANS AND BICYCLISTS FOCUS AREA
YOUNG DRIVERS AND OLDER DRIVERS FOCUS AREA
MOTORCYCLES, ALL-PURPOSE VEHICLES, AND SNOWMACHINES FOCUS AREA
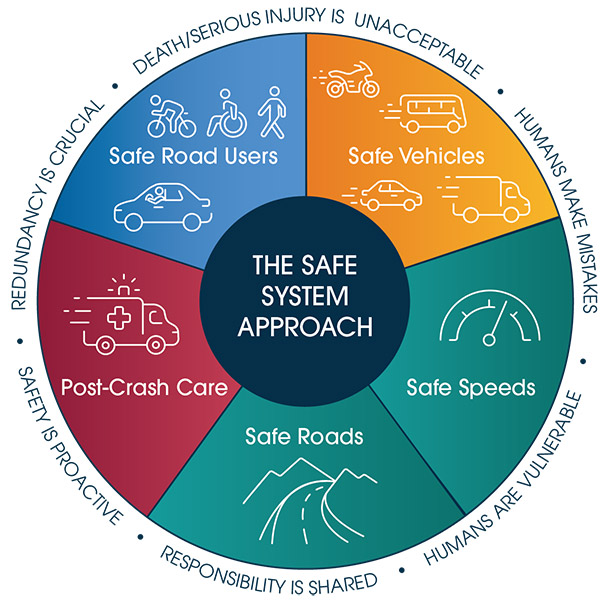
THE SAFE SYSTEM APPROACH AND SHSP EMPHASIS AREAS
This SHSP is grounded in the Safe System Approach, which consists of six principles and five elements. The Safe System Approach is the core tenet of the National Roadway Safety Strategy to significantly reduce serious injuries on our nation's highways, roads, and streets.
Alaska believes in our shared responsibility to proactively make our roads and vehicles safer for everyone. Multiple elements of the transportation system should address risks and contributing factors of crashes, protecting roadway users through redundancy in case one or more elements fail.
The Emphasis Areas set the priorities for where Alaska has chosen to focus funding, resources, and effort to reduce fatalities and serious injuries. Alaska's four SHSP Emphasis Areas reflect the Safe System Approach elements: Safe Road Users, Safe Roads and Safe Speeds, Safe Vehicles, and Post-Crash Care.
Figure 1: The SHSP Emphasis Areas as the elements of the Safe System Approach, supported by six foundational principles.
INTRODUCTION TO FOCUS AREAS
Each Emphasis Area has Focus Areas that direct Alaska's efforts towards specific types of road users, behaviors, vehicles, and infrastructure.
The SHSP has eight Focus Areas:
- Pedestrians and Bicyclists
- Young Drivers and Older Drivers
- Motorcycles, All-Purpose Vehicles, and Snowmachines
- Dangerous Driving
- Roadways
- Speed Management
- Emergency Response
- Vehicle Safety
Figure 2: Each SHSP Emphasis Area is supported by one or more Focus Areas.

Each Focus Area has a dedicated team of safety partners and experts. Each Focus Area also has an action plan of strategies and action steps to increase traffic safety and eliminate deaths and serious injuries.
Additionally, the Alaska Highway Safety Office leads the Impaired Driving Task Force, Occupant Protection Task Force, and Alaska Traffic Records Coordinating Committee.
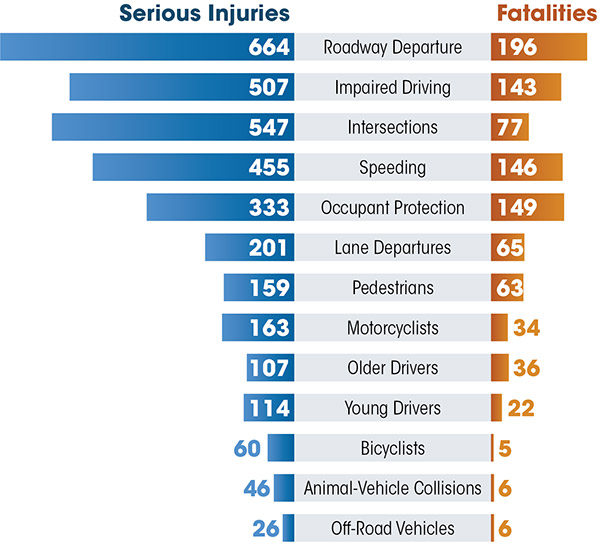
Figure 3: Total traffic fatalities and serious injuries between 2016 and 2020, broken down by crash characteristics.
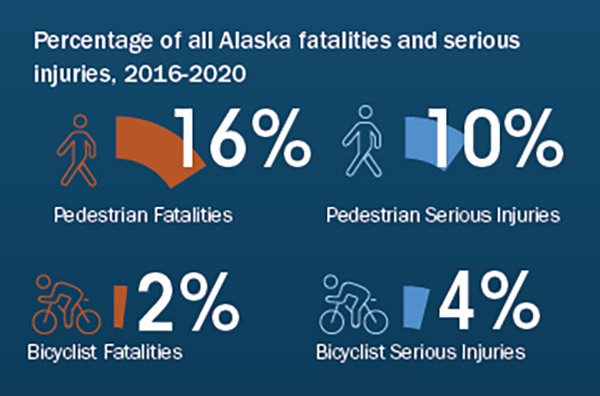
PEDESTRIANS AND BICYCLISTS FOCUS AREA
Emphasis Area: Safe Road Users
The people who walk, bike, and roll on our roadways are Alaska's most vulnerable road users. Vulnerable road users include pedestrians, bicyclists, people in wheelchairs or using mobility assistive devices, people on skateboards or roller skates, children playing, and highway workers on foot in work zones. These people are considered "vulnerable" because they lack the visibility, protection, and deference given to motor vehicles.
It is imperative to design, maintain, and operate a transportation system that plans for and protects those who choose to walk, bike, and roll in their communities. This means providing visible and protected spaces for pedestrians and bicyclists to move freely. It also means creating equitable environments where all people can walk regardless of mobility level, including older people, individuals with disabilities or mobility assistive devices, and caregivers with small children.
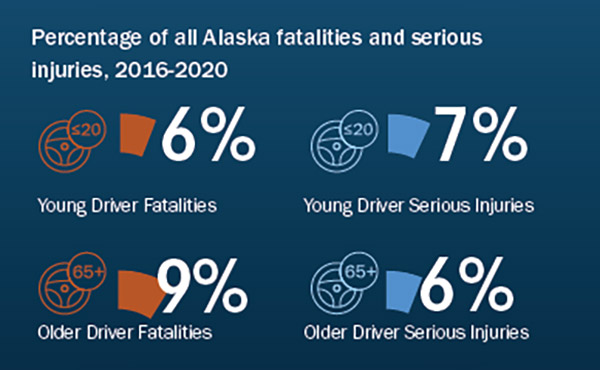
YOUNG DRIVERS AND OLDER DRIVERS FOCUS AREA
Emphasis Area: Safe Road Users
Young drivers (ages 20 and younger) are new to driving and less knowledgeable about the road. Young drivers may underestimate risks and therefore make unsafe decisions, such as driving while texting or speeding.
Driving is an essential way for many older adults (ages 65 and above) to thrive in their communities, including access to recreation, healthy food, and medical care. Mobility independence for older adults is vital and sometimes challenging with Alaska's long distances in rural regions, poor visibility during prolonged darkness, or snowy and icy roadway conditions in winter.
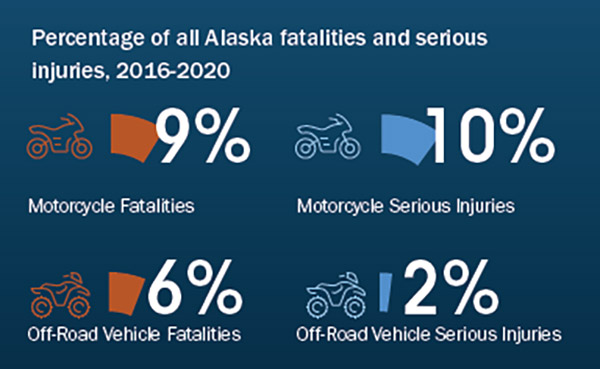
MOTORCYCLES, ALL-PURPOSE VEHICLES, AND SNOWMACHINES FOCUS AREA
Emphasis Area: Safe Road Users
Riders of motorcycles, all-purpose vehicles, and snowmachines are unshielded, meaning they are not protected by a vehicle body while riding. An all-purpose vehicle (APV) is an all-terrain vehicle that is used on public roads or highways with a speed limit of 45 miles per hour or less. Motorcycles, APVs, and snowmachines have unique steering and stability characteristics that require skill and training to operate safely.
It is essential that operators of these types of vehicle wear proper safety equipment (including helmets and high visibility clothing) on these types of vehicles. It is also important to educate other vehicle drivers on how to safely share the road with motorcycles, APVs, and snowmachines.
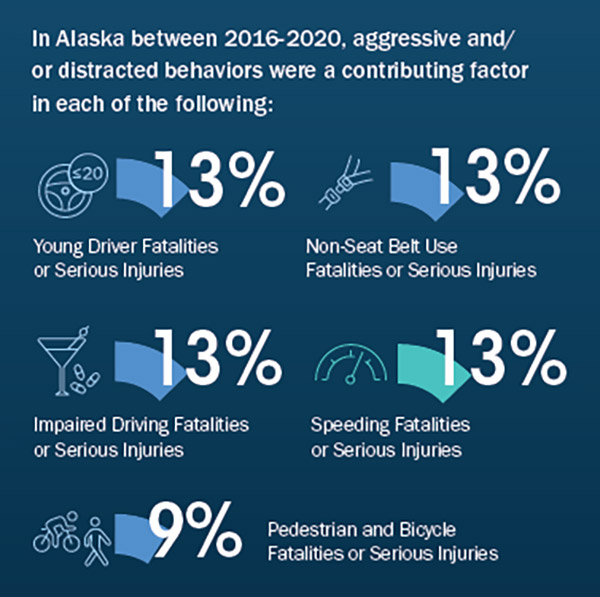
DANGEROUS DRIVING FOCUS AREA
Emphasis Area: Safe Road Users
It is essential to encourage safe driving and responsible behaviors for vehicle drivers and operators, i.e., giving the task of driving your complete attention. Dangerous driving behaviors mean the driver is not fully aware of their surroundings or does not accept their responsibility to drive safely.
Dangerous drivers put themselves and all road users at risk.
Aggressive driving includes racing, exceeding the speed limit, driving too fast for conditions, following a vehicle too closely, unsafe lane changes, or running stop signs or red lights.
Distracted driving means taking your eyes off the road, your hands off the wheel, or your mind off of driving. this includes texting or using handheld devices, eating, drinking, focusing on other car passengers, or fiddling with the stereo or navigation system.
Drowsy driving is driving while feeling sleepiness or fatigue, usually when a driver has not slept enough.
Speeding and impaired driving are dangerous driving behaviors addressed by other Focus Areas or Task Forces.
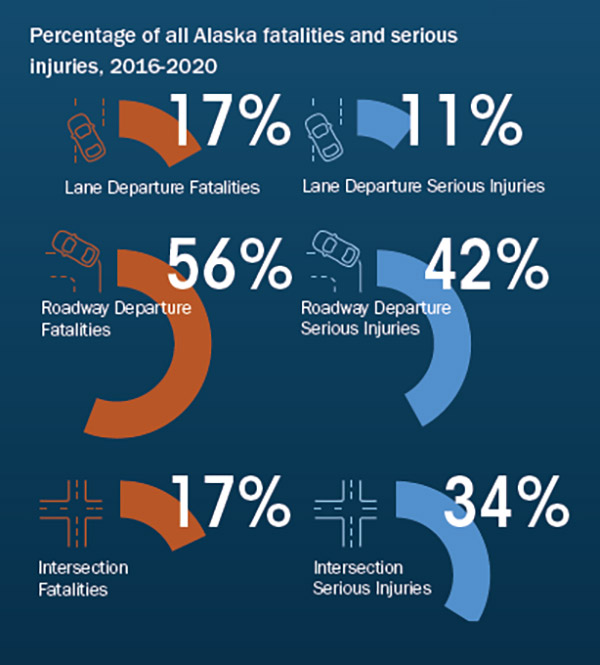
ROADWAYS FOCUS AREA
Emphasis Area: Safe Roads and Safe Speeds
The design and operation of Alaska's roadways influences driver behaviors, vehicle speeds, and contributing circumstances to crashes. The roadway and surrounding environment provide cues to drivers such as how fast to drive, when to pass, and where to look for other cars or people. It is important to design roadways that protect all road users fitting the roadway's context and purpose.
Lane and roadway departure crashes occur when a vehicle leaves its travel lane and either has a non-collision crash or collides with another vehicle, people, structures, trees, or other objects. In a lane departure crash the vehicle remains on the roadway, whereas the vehicle completely leaves the roadway in a roadway departure crash.
Intersections are roadways where vehicles traveling in different directions may come together, including at-grade rail crossings. Pedestrians and bicyclists may also be present at intersections. This convergence of roadways creates conflict points that require the full attention of each road user to safely cross or pass through. Road users have to pay attention to traffic control devices, where and when other vehicles are going, and people in and near the roadway.
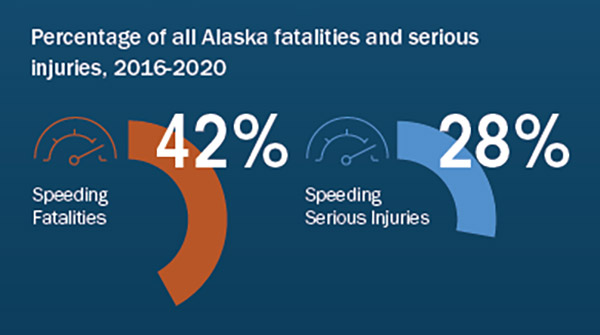
SPEED MANAGEMENT FOCUS AREA
Emphasis Area: Safe Roads and Safe Speeds
Speeding is dangerous to all road users. The human body is vulnerable, and increased speeds mean increased impact forces on the body during a crash - often fatal for vulnerable road users such as pedestrians and bicyclists even at lower speeds. Motorcyclists, all-purpose vehicle riders, and snowmachine riders are also more vulnerable to the physical impact of a crash.
Speeding makes crashes more likely and more deadly, particularly when paired with other dangerous driving behaviors.
EMERGENCY RESPONSE FOCUS AREA
Emphasis Area: Post-Crash Care
After a crash, prompt emergency response and effective incident management can make the difference between an injury and a death.
The quick arrival of emergency responders can save lives. However, in Alaska's rural areas, emergency response times may be long as first responders must travel great distances. These prolonged response times mean life-saving medical treatment is delayed for injured crash victims.
Effective and efficient traffic incident management can prevent further injuries. quickly and safely clearing a crash scene can save additional lives by minimizing the risk of a secondary crash. It also protects the lives of emergency responders, emergency medical services, fire departments, law enforcement, road service workers, and tow operators at the scene of the crash.
SLOW DOWN AND MOVE OVER: It is the law in Alaska to slow down when approaching a stationary ambulance, fire vehicle, law enforcement vehicle, tow truck, maintenance vehicle, or vehicle with emergency flashing lights. If the road has two or more lanes traveling in the same direction, also move over to the lane farther away from the stationary vehicle. (Alaska Statute 28.35.185)
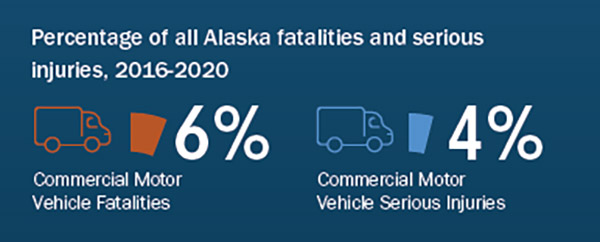
VEHICLE SAFETY FOCUS AREA
Emphasis Area: Safe Vehicles
The majority of road users and commercial goods travel by vehicle on Alaska's roads. Different types of vehicles and safety technologies can influence the occurrence and severity of crashes. It is essential that commercial vehicle drivers drive responsibly, while other roadway users operate safely around commercial vehicles. Vehicle safety equipment also plays a key role in mitigating the harm of crashes with both long-standing and emerging safety technologies. It is important that vehicle operators know how to use - and don't turn off - their vehicle's safety features.