
Whittier Traffic Data
During the years of operation the tunnel has had to adapt to changes in traffic types and volumes. The return of the cruise ships to Whittier brought to the tunnel welcomed tourism in the form of buses. The tunnel operation adapted to accomodate larger numbers of buses. In 2004, 2005 and 2006 receation seekers discovered the beauty and convenience of Prince William Sound and the tunnel saw an influx of boaters. As Whittier develops the tunnel will adapt and grow with it.
In order to adapt to changes in traffic, the Department of Transportation records data on traffic type, direction of travel, and volumes during the day. Using this information changes in the schedule, traffic timing, and operation are developed and implemented. The goal is to safely serve as many tunnel users as possible in the time allowed.
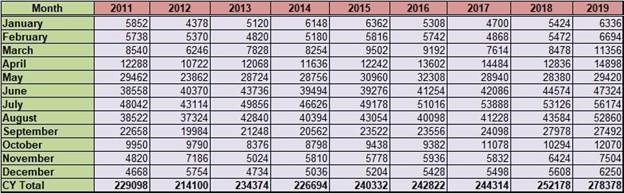
The following graph illustrates the traffic usage in percentages of the total and by classes
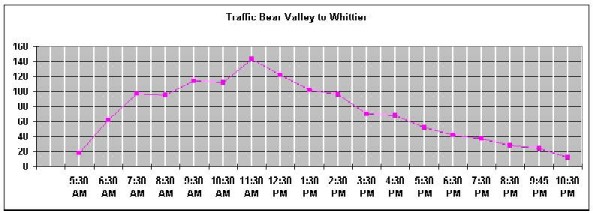
The table bellow illustrates the typical traffic demand into Whittier at each opening
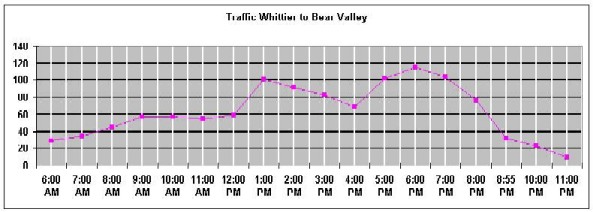
The table bellow illustrates the typical traffic demand out of Whittier at each opening
For further information on traffic usage at the tunnel, please contact the Facilities Manager at the address below:
Gordon S. Burton, Facility Manager (tel) 907-472-2584
Alaska Department of Transportation and Public Facilities
5820 East Tudor Road Anchorage, Alaska 99507
Fax: 907-472-2533
e-mail: gordon.burton@alaska.gov


The Tunnel
- Whitter Access Tunnel Home
- Schedule & Hours of Operation
- Accomplishments
- Virtual Drive
- Vehicle Size, Tunnel Restrictions
- Tolls
- Project History
- Design
- Construction Photos
- Operations
- Traffic Data
- Motorcycle Safety Information
- Regulations
- FAQs
- Weather
- Current Weather
- FAA Weather Cams
Related Resources
- 511.alaska.gov -
Traveler Information - Alaska Railroad Corp.
- Alaska Marine Highway
- Chugach National Forest
- Chugach Alaska Corp.
- City of Whittier